1 Introduction
As a high-quality, efficient and clean transitional energy in the process of China's low-carbon energy transformation, natural gas is of great significance to meet overall energy demand, optimize energy structure, improve ecological environment and achieve carbon neutrality. In the medium and long term, in order to achieve China's goal of 15% of primary energy consumption by 2030, the key is to promote the large-scale development of three main consumption areas of natural gas, including power generation, chemical and industrial fuel sectors. The application of natural gas in power generation, chemical and industrial fuel can not only replace traditional energy such as coal and oil, but also supplement new energy such as wind energy, solar energy and nuclear energy. From the development experience of developed countries in the world, natural gas power generation is a way to achieve energy conservation, emission reduction, and sustainable development of energy supply. From the perspective of carbon emission costs, the cost of natural gas power generation is lower than that of coal power generation (Zhu, et al.
[1]). In 2019, China's gas for power generation accounted for 18% of the natural gas consumption structure. The US Energy Information Administration (EIA) predicted that China's annual average growth rate of natural gas power generation from 2010 to 2040 will be 7.7%, ranking first in the world, much higher than the average growth rate of 2.5% of the world's natural gas power generation. Secondly, the use of natural gas in chemical and industrial fuels is also a development trend in the modern energy field, which can promote the diversified development of China's energy consumption. In 2019, the natural gas consumption of China's industrial fuel and chemical sector accounts for 30% and 11% of the natural gas consumption structure respectively. Natural gas used in chemical sector is an excellent raw material for manufacturing methanol and synthetic oil, which has the characteristics of low cost and low pollution; Taking natural gas as industrial fuel can achieve a sound development of increased production, energy saving, and consumption reduction.
Furthermore, although China has formed a multi-channel supply pattern of "west-east gas transmission, Sichuan-east gas transmission, north gas flowing to the south, sea-gas landing, imported pipeline gas and liquefied natural gas", China's energy endowment presents the characteristics of "rich coal, lack of oil and less gas", and there may be an imbalance between supply and demand in natural gas market, thus affecting China's energy security. At the same time, with the tidal phenomenon of natural gas consumption, the diversification and complexity of supply entities and channels, the factors that affect natural gas consumption in different sectors also have variability and heterogeneity. Analyzing the evolution mechanism of natural gas consumption in different sectors has practical value for solving the security of natural gas supply under the current situation of increasing seasonal peak valley difference year by year. The accurate prediction of natural gas consumption in various sectors in the short term is of reference significance for realizing the moderate peak load under the regional distribution of gas fields in China. Based on this, we select 11 variables from 5 aspects as possible factors affecting natural gas consumption in three sectors. Bayesian network model (BN) is used to conduct quantitative research and inference analysis on the driving factors of natural gas demand in the three sectors. Combined with Bayesian model average model (BMA) and scenario analysis, the natural gas consumption of power generation, chemical and industrial fuel sectors from 2021 to 2025 is predicted.
2 Literature Review
As an important research content in the field of energy economy, the analysis and prediction of natural gas consumption has attracted extensive attention of scholars at home and abroad. This paper believes that the existing literature mainly focused on the following two aspects.
In terms of the influencing factors of natural gas consumption, Ervural, et al.
[2] believed that accurate prediction of natural gas consumption plays a crucial role in energy prediction and economic development, and underestimation of natural gas consumption will make the demand for industrial and residential gas unable to be met. Lin and Li
[3] analyzed the relationship between natural gas demand and variables of residential, industrial and commercial sectors during 1985
2017, and found that residential sectors are the most sensitive to changes in natural gas prices, urbanization process and income level have significant positive effects on natural gas demand of each sector. The research results of Liu, et al.
[4] showed that the influence coefficients of natural gas price and household income on average natural gas consumption are
and 0.222, respectively, and the influence coefficients of natural gas consumption population are
and 0.346, respectively. Zhang, et al.
[5] found in their study that the long-term price elasticity of natural gas demand in other sectors except residential gas is greater than 0, and the demand for natural gas in industrial and power generation is a supplement to coal. Obringer, et al.
[6] proposed a multi-variable and multi-sector (residential, commercial, industrial and power plant) framework, and modeled the climate sensitivity of electricity and natural gas demand at the same time. The results showed that the number of heating and cooling days and dew point temperature from season to date are key indicators for power and natural gas demand prediction.
In terms of prediction methods for natural gas consumption, Zhu, et al.
[7] used SVRLP (support vector regression local predictor) and FNF-SVRLP (false neighbor filter support vector regression local predictor) methods based on SVR (support vector regression local predictor) to predict short-term natural gas demand, and the results showed that their prediction performance is good. Fan, et al.
[8] proposed a combination prediction model, GM-S-SIGM-GA, to predict China's natural gas demand from 2011 to 2017, and the experimental results illustrated that the prediction results of this model are statistically significant at 97.5% confidence level. Zhou, et al.
[9] designed a new discrete gray model considering non-linearity and volatility, adopted cultural algorithm (CA) to determine the emerging parameters of the model, and predicted the natural gas demand in Jiangsu Province, China. The results showed that the new model is more accurate and reliable. Chen, et al.
[10] proposed a hybrid prediction model of functional autoregression and convolutional neural network to predict the hourly natural gas flow of 92 nodes in the German high-pressure natural gas pipeline network in a short term, and the results showed that the model have good and stable accuracy for different types of nodes. Papageorgiou, et al.
[11] established ANFIS architecture for energy demand prediction based on neural fuzzy exploration performance and historical data of natural gas consumption. Compared with other artificial neural networks, it showed that the model achieves high prediction accuracy.
To sum up, scholars at home and abroad have done some studies on the influencing factors and prediction methods of natural gas consumption, but few have conducted a more refined quantitative analysis of the influencing factors and prediction of natural gas consumption from the sector dimension. Based on this, the highlights of this paper lie in two aspects: Firstly, on the premise of considering the heterogeneity of the sector, we analyze the factors that may affect the natural gas consumption of the three sectors in an all-round and multi-angle, and forecast their natural gas consumption, supplement the existing literature. Secondly, BN model is constructed to quantitatively analyze the driving factors and influence mechanism of natural gas consumption in the three sectors, and the direct or indirect causal relationship between variables can be more clearly and intuitively presented. We expand the application field of Bayesian network model.
3 Methodology
3.1 Bayesian Network Model
Bayesian network, also known as directed acyclic graph (DAG), was proposed by Pearl
[12]. It is an intelligent system mainly applied to computer intelligence science, industrial control, medical diagnosis and other fields. It is used to describe the conditional probability distribution and causality between variables. BN integrates statistical data into the model in the form of conditional probability, and combines prior knowledge with posterior data for reasoning and diagnosis. The probability of any node under given evidence can be calculated by using this model according to Bayesian theory. Bassamzadeh, et al.
[13], Malagrino, et al.
[14], Prishchepov, et al.
[15], Chai, et al.
[16], Chai, et al.
[17] used BN to solve the research problem.
The formal Bayesian network is defined as = (, ), is DAG, nodes are random variables and edges represent the direct causal nexus between variables. Bayesian networks satisfy the causal Markov hypothesis, given the parent node in , each variable is independent of its non-offspring in . is the set of network parameters, including the parameters of each with as the condition, , is the set of parent nodes of in . Thus, Bayesian network defines the unique joint probability distribution of all variable sets. According to the assumption of independence:
3.2 BMA Model
BMA model assigns corresponding prior probability to explanatory variables in the model according to prior information, and takes the posterior inclusion probability (PIP) of all potential explanatory variables as the criterion to judge the merits and demerits of the model. Specifically, assuming that explanatory variable is involved in the models required to be estimated, different models about the explained variable can be formed, and these models are defined as . Meanwhile, the sample data is defined as , where represents the observed value at time . Assume that the prior probability of the model is , then the posterior probability is:
If is the vector of each regression coefficient in model , then:
Posterior inclusion probability:
Posterior mean value:
Posterior variance:
In addition, we use root mean square error (RMSE) to measure the prediction accuracy of the model:
where is the observed value, is the predicted value, and is the number of dependent variables in the predicted set.
4 Variables and Modeling
4.1 Variable Selection
We draw on relevant research experience and conclusions at home and abroad and follow the principle of data availability to summarize the factors affecting the consumption of power generation, chemical and industrial fuel sectors. 11 influencing factors are selected and divided into: Total factors (industrial value-added growth, natural gas production and pipe length), structural factors (industrial structure, urbanization rate and energy consumption structure), technical factors (energy consumption intensity, energy processing and conversion efficiency), market factors (natural gas price and coal price) and policy factors (environmental governance intensity).
Total and structural factors are the motive forces for the development of natural gas consumption market, while technical factors, market factors and policy factors are the driving forces for natural gas consumption. First of all, as a large energy demand country, China's economic growth provides technical and financial support for the development and production of natural gas and promotes natural gas consumption. The rationality of industrial structure is a necessary condition for economic growth. The structural effect obtained by the upgrading of industrial structure can promote economic growth, and natural gas is mainly used in industrial fields, The energy consumption index of the secondary industry is much higher than that of the primary and tertiary sectors. Therefore, with the adjustment of industrial structure, the comprehensive energy consumption index will be affected. At present, industry is the main sector driving China's GDP growth. Industrial added value is the newly added value in the production process of enterprises, which can reflect China's economic growth level to a certain extent. Due to the high proportion of the secondary industry with high pollution and energy consumption, the proportion of added value in GDP can reflect the development level of China's industrial structure. Therefore, we collect the year-on-year growth rate of industrial added value and the proportion of secondary industry added value in GDP to represent the level of economic development and industrial structure respectively.
Secondly, natural gas is non-renewable energy, China is short of natural gas resources. The unique chemical properties of natural gas make it need to be processed and gasified and transported to the consumption terminal by pipeline, which costs a lot. Demand theory shows that price is an important factor affecting consumption, so natural gas production, price and pipeline infrastructure construction will all have an impact on natural gas consumption. Therefore, in this paper, natural gas production, price and pipeline length are considered in the analysis of natural gas consumption in different sectors. Besides, China's energy consumption is mainly dominated by coal and oil, which are the main substitutes for natural gas. From the substitution effect, we can see that their price and proportion in the energy consumption structure have a close impact on natural gas consumption. Therefore, coal price and the proportion of the sum of crude oil and raw coal consumption in the total energy consumption are included in the model for analysis.
Moreover, the urbanization rate reflects the development of human society and the change of population structure. People are the main body of consumption. With the adjustment and change of population structure, the natural gas consumption of the three sectors will be affected. Furthermore, economic growth theory indicates that technological progress is a decisive factor to ensure sustained economic growth, energy intensity reflects the changes in China's economic structure and energy use efficiency. The improvement of energy processing and conversion efficiency will improve the utilization efficiency of natural gas. Therefore, energy intensity and energy processing and conversion efficiency will affect the natural gas consumption of the three sectors. Finally, in the context of high-quality economic development and carbon neutrality goals, the natural gas consumption of the three sectors will be driven by environmental protection policies. We use the ratio of China's environmental pollution control investment to GDP to express the intensity of environmental governance.
Bayesian network allows node variables to be discrete variables, continuous variables, or even incomplete data sets. The discrete Bayesian network data is discrete, and the model does not specify the specific distribution type, while the continuous Bayesian network assumes that the variables are linear, and the joint distribution of all random variables is multi-variable normal distribution. In view of the strictness of Gaussian Bayesian network hypothesis, we select discrete Bayesian network for research, and gather the monthly data of the above variables from January 2003 to June 2020. The data are from Wind database and the National Bureau of Statistics. All data are discretized into three segments in equal frequency. The selected indicators and discretized data are shown in Table 1 and Table 2.
Table 1 Influencing factors of natural gas consumption in three sectors |
| Factors | Indicators | Variable | Discretization | References |
| Total | Industrial value-added growth | IV | < 7.9%: low; ≥14.7%: high; [7.9%, 14.7%): medium | Chai, et al.[18]; Chai, et al.[19]; |
| factors | Natural gas production | NG | [0, 314): low; ≥644: high; [314, 644): medium | Liang, et al.[20]; |
| Pipe length | PL | [0, 184084): low; ≥434571: high; [184084, 434571): medium | Wang and Lin[21]; Li, et al.[22] |
| Structural | Industrial structure | IS | [0, 0.43): low; [0.47, 1): high; [0.43, 0.47): medium | Yang, et al.[23]; Li, et al.[24]; |
| factors | Urbanization rate | UR | [0, 0.47): low; [0.55, 1): high; [0.47, 0.55): medium | Liang, et al.[25]; |
| Energy consumption structure | ES | [0, 0.91): low; [0.92, 1): high; [0.91, 0.92): medium | Feng, et al.[26] |
| Technical | Energy intensity | EI | [0, 19.30): low; ≥29.27: high; [19.30, 29.27): medium | Feng, et al.[26]; Chai, et al.[19]; |
| factors | Energy processing and conversion efficiency | EE | [0, 72%): low; [73%, 1): high; [72%, 73%): medium | Liao, et al.[27]; Chai, et al.[28] |
| Market | Natural gas price | GP | [0, 3.83): low; ≥5.78: high; [3.83, 5.78): medium | Wang and Lin[29]; Lin and Li[30]; |
| factors | Coal price | CP | [0, 499): low; ≥628: high; [499, 628): medium | Cebula[31]; Berk and Ediger[32] |
| Policy factors | Environmental governance intensity | EG | [0, 0.012): low; ≥0.015: high; [0.012, 0.015): medium | Alabdulwahab, et al.[33] |
Table 2 Natural gas consumption of three sectors |
| Natural gas consumption sector | Variable | Discretization |
| Power generation sector | PG | [0, 6.88): low; [6.88, 21.94): medium; 21.94: high |
| Chemical sector | CG | [0, 16.11): low; [16.11, 22.94): medium; 22.94: high |
| Industrial fuel sector | IG | [0, 20.72): low; [20.72, 44.67): medium; 44.67: high |
4.2 Model Application
Bayesian network model includes structure learning and parameter learning. There are two methods to determine the network structure: Manually drawing the network structure diagram by using expert knowledge and establishing the causal relationship of each node by using data learning. As the factors affecting the natural gas consumption of the three sectors studied in this paper are rarely referred to by experts, and manual drawing of the network structure is subjective and one-sided. Therefore, mountaineering search method (HC algorithm) based on
2 scoring function is adopted to determine the network structure (Cooper and Herskovits
[34]). There are usually two methods for parameter learning in Bayesian networks: Maximum likelihood estimation and Bayesian estimation. We utilize the maximum a posteriori probability (map) in Bayesian estimation to learn parameters. Using the above methods to learn the structure and parameters of Bayesian network for the data, the Bayesian network models of natural gas consumption in the three sectors shown in
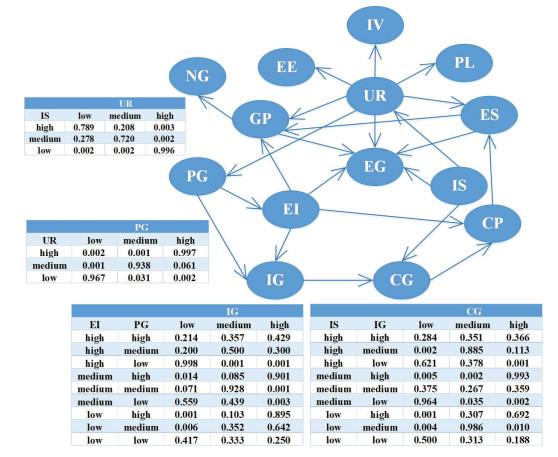
Figure 1 are obtained.
Figure 1 Bayesian network model of natural gas consumption in three sectors |
Full size|PPT slide
5 Discussions
5.1 Analysis of Natural Gas Consumption in Three Sectors
In Figure 1, the direct factor affecting natural gas consumption in the power generation is the urbanization rate. The conditional probability in the P(PG) table shows that when the urbanization rate is in the range , , , the maximum probability of natural gas consumption in power generation is in the interval , , , and the probabilities are 0.967, 0.938, and 0.997, respectively. That is, the high gas consumption for power generation is mainly due to the probability of high urbanization rate is 0.997, the medium gas consumption for power generation is mainly due to the probability of medium urbanization rate is 0.938, and the low gas consumption for power generation is mainly due to the probability of low urbanization rate is 0.967. It reveals that there is an obvious positive relationship between gas consumption for power generation and urbanization rate. Urbanization improves people's living standards, promotes industrial development, and leads to an increase in residential and industrial power consumption. Natural gas power generation has the functions of flexible start and stop, peak shaving and valley filling, which can enhance the stability and security of power supply. Therefore, the development of natural gas power generation is inseparable from the advancement of urbanization.
The direct influencing factors of natural gas consumption in chemical sector are industrial structure and industrial fuel gas consumption. the conditional probabilities 0.993, 0.964 and 0.986 in P(CG) table show a strong causal relationship between natural gas consumption in chemical sector, industrial structure and industrial fuel gas consumption. The conditional probabilities 0.366, 0.885 and 0.621 indicate that when the industrial structure is certain and the natural gas consumption of industrial fuel is in the state of high, medium and low, the maximum probability of natural gas consumption in the chemical sector is also in the range of high, medium and low respectively. That is, the increase of industrial fuel gas consumption will promote the natural gas consumption of the chemical sector. The conditional probabilities 0.366 and 0.692, 0.885 and 0.986, 0.621 and 0.500 indicate that the optimization of industrial structure plays a significant role in promoting natural gas consumption in chemical sector. Although China's industrial fuel is still dominated by coal at present, industry is the main sector of natural gas consumption. The optimization of industrial structure and the increase of industrial fuel gas consumption indicate that China's energy consumption structure and the quality of economic development have improved, which has a significant effect on promoting natural gas consumption in chemical sector.
The direct influencing factors of industrial fuel natural gas consumption are energy intensity and gas consumption for power generation. The conditional probabilities 0.998, 0.901 and 0.928 in the P(IG) table show a strong causal relationship between industrial fuel gas consumption and energy intensity and power generation gas consumption. The conditional probabilities 0.500, 0.928 and 0.642 show that when the power generation gas consumption is in a certain state, the probability of industrial fuel gas consumption being in a medium state increases with the decrease of energy consumption intensity. Therefore, the reduction of energy intensity is conducive to the increase of industrial fuel gas consumption. Besides, the conditional probabilities of 0.429, 0.500 and 0.998 indicate that the industrial fuel consumption increases with the increase of gas consumption for power generation when energy intensity is constant. Compared with the change of energy consumption intensity, industrial fuel gas consumption is more sensitive to the change of power generation gas consumption. As a key sector to reduce energy consumption and emission in China, the natural gas consumption of industrial fuels will increase with the establishment of the double control goal of total energy and intensity. Because power demand is the leading indicator of economic development, the improvement of power generation gas is conducive to the stability of power consumption and economic development of the industrial sector, thus further promoting the consumption of industrial fuel natural gas.
Meanwhile, Figure 1 and related conditional probability also reflect that the direct factor affecting natural gas production is natural gas price, and the increase of natural gas price will have a positive impact on natural gas production, which conforms to the market supply theorem, namely, the higher the commodity price, the greater the supply of producers. The direct factors affecting natural gas price are urbanization rate, energy consumption structure and energy consumption intensity. The direct and main influencing factors of environmental governance intensity are natural gas price, urbanization rate, industrial structure, energy intensity and energy consumption structure. The natural gas consumption of the three sectors will indirectly affect the energy consumption structure, and then affect the intensity of environmental governance and natural gas prices. Besides, industrial structure is the direct factor affecting the urbanization rate. The conditional probability in P(UR) table shows that when the industrial structure is in the interval , , , the maximum probability of urbanization rate is in the interval , , , with probability 0.789, 0.720 and 0.996, respectively. That is, there is a significant negative correlation between the urbanization rate and the proportion of the added value of the secondary industry.
5.2 Natural Gas Consumption Forecast of Three Sectors
In summary, industrial structure and urbanization rate will directly or indirectly affect the natural gas consumption of the three sectors, and with the upgrading of industrial structure and the acceleration of urbanization, the gas consumption of the three sectors will increase. Because the prediction result of Bayesian network is in an interval, rather than an exact value. Therefore, in order to improve the accuracy of prediction, industrial structure and urbanization rate are taken as independent variables and gas consumption of the three sectors as dependent variables respectively. Three BMA models are constructed to predict the natural gas consumption of the three sectors. Since the monthly data of industrial structure and urbanization rate are relatively stable, the annual gas consumption of the three sectors is obtained by adding the gas consumption of each 112 months. Therefore, in order to improve the convenience of prediction and adaptability to BMA model, we integrate the selected variable data into the annual data from 2003 to 2019, follow the 70 / 30 principle, use the data set from 2003 to 2014 to establish BMA model, and use the data from 2015 to 2019 to test the model. Then, the natural gas consumption of the three sectors under the three scenarios during 20212025 is predicted combined with the scenario analysis method.
Table 3 shows the BMA models of the three sectors. The posterior including probability (PIP) indicates that the natural gas consumption of the three sectors is affected by industrial structure and urbanization rate. The posterior mean (EV) demonstrates that the optimization of industrial structure and acceleration of urbanization will increase the natural gas consumption of the three sectors, which is consistent with the previous results.
Table 3 BMA model of three sectors |
| Variable | PIP(%) | EV | SD |
| PG | IS | 45 | -325.3 | 517.2 |
| UR | 100 | 1969.8 | 146.5 |
| CG | IS | 68.4 | -1003.5 | 935.5 |
| UR | 100 | 1034.4 | 228.4 |
| IG | IS | 100 | -3080.4 | 814.7 |
| UR | 100 | 2446.0 | 214.6 |
In order to test the accuracy of BMA model prediction, RMSE is used as the evaluation standard. Compared with the classical ARIMA prediction model and BMA model, the natural gas consumption of the three sectors from 2015 to 2019 is predicted. The results show that the RMSE value of BMA model and ARIMA model is 91.7258 and 111.6820 respectively when predicting the natural gas consumption in power generation sector. When predicting the natural gas consumption in chemical sector, the RMSE value of BMA model is 97.0475, and that of ARIMA model is 102.8656. When predicting the natural gas consumption in industrial fuel, the RMSE value of BMA model is 105.0461, and that of ARIMA model is 123.0884. The above results indicate that the RMSE value of BMA model is smaller than that of ARIMA model, and the predicted value of BMA model is closer to the real value than that of ARIMA model, demonstrating that the prediction accuracy of BMA model is higher. In order to predict the natural gas consumption of the three sectors from 2020 to 2025, according to the historical development characteristics and combining with the current trend, we set a baseline scenario for the average annual growth rate of urbanization rate and industrial structure, and set the other two scenarios after adjusting the changes of explanatory variables on the basis of the baseline scenario.
Urbanization rate: Jian and Huang
[35] believed that China's urbanization development is a flattening
-shaped curve, a process of slow, accelerated, and then slowed down. The average annual growth rate of China's urbanization will remain at 1% until at least 2020, and the urbanization will slow down during 2020
2050. According to the China Rural Development Report 2020, China's urbanization rate will reach 65.5% by 2025, with an average annual growth rate of 1.3% from 2020 to 2025. China's Population Development Plan (2016
2030) predicted that 70% of China's permanent population will be urbanized by 2030. Li, et al.
[36] predicted that China's urbanization rate would reach 61.5% in 2020 and 69.64% in 2030, so the average annual growth rate of urbanization from 2020 to 2030 would reach 1.25%. Accordingly, we set the baseline scenario of the annual average growth rate of urbanization from 2020 to 2025 as 1%, and the other two scenarios are set as the baseline scenario floating up and down by 0.3% respectively.
Industrial structure: Li, et al.
[36] predicted that the proportion of added value of the secondary industry in China will be 38.24% in 2021 and will drop to 36.09% in 2025, so the average annual growth rate of the proportion will reach
in 2021
2025. Besides, we utilize historical data to predict the proportion of added value of the secondary industry in the future through ARIMA model, and the results show that its annual growth rate will be
from 2021 to 2025. Accordingly, the baseline scenario of the average annual growth rate of the added value of the secondary industry in 2020
2025 is set as
, and the other two scenarios are set as the baseline scenario floating up and down by 0.52% respectively. As mentioned above, there is a significant negative correlation between the urbanization rate and the proportion of added value of the secondary industry. Therefore, the following three scenarios are named as low development scenario, base scenario and high development scenario respectively: The added value of the secondary industry accounts for a high proportion and low urbanization rate; the added value of the secondary industry accounts for a high proportion and high urbanization rate; and the added value of the secondary industry accounts for a low proportion and high urbanization rate.
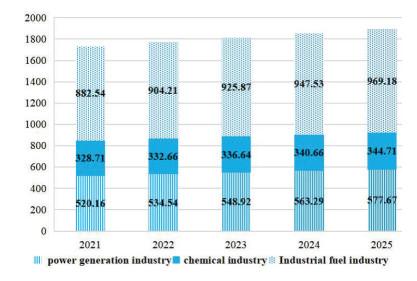
The forecast results of natural gas consumption of the three sectors under the three scenarios are shown in Figures 2, 3 and 4. It is estimated that in 2025, under the high development scenario, China's natural gas consumption for power generation, chemical and industrial fuel sectors will be 66.034 billion cubic meters, 36.552 billion cubic meters and 109.414 billion cubic meters respectively, and the average annual growth rate of natural gas consumption in the three sectors from 2021 to 2025 will be 4.82%, 2.18% and 4.43%, respectively. Under the baseline scenario, the gas consumption of power generation, chemical and industrial fuels sector is 61.299 billion cubic meters, 35.528 billion cubic meters and 102.226 billion cubic meters respectively, with an annual average growth rate of 3.83%, 1.69% and 3.43% in 20212025. Under the low development scenario, the natural gas consumption of power generation, chemical and industrial fuel sectors is 57.767 billion cubic meters, 34.471 billion cubic meters and 96.918 billion cubic meters respectively, and the average annual growth rate of natural gas consumption of the three sectors from 2021 to 2025 is 2.66%, 1.20% and 2.37%, respectively.
Figure 2 The predicted value of natural gas consumption in the three sectors under high development scenario |
Full size|PPT slide
Figure 3 The predicted value of natural gas consumption in the three sectors under the baseline scenario |
Full size|PPT slide
Figure 4 The predicted value of natural gas consumption in the three sectors under the low development scenario |
Full size|PPT slide
6 Conclusions
In this paper, a Bayesian network model is established based on 11 factors that may affect natural gas consumption in power generation, chemical and industrial fuel sectors, and the main influencing factors and influencing mechanism are analyzed. Based on the analysis results, the BMA model is built to predict the natural gas consumption of the three sectors from 2021 to 2025. The research conclusions are as follows:
Firstly, the urbanization rate is the direct positive influence factor of natural gas consumption in power generation. Secondly, the direct influencing factors of natural gas consumption in chemical sector are industrial structure and industrial fuel gas consumption, the optimization of industrial structure and the increase of industrial fuel consumption can promote natural gas consumption in chemical sector. Thirdly, the direct influence factors of industrial fuel natural gas consumption are energy intensity and power generation gas consumption. The decrease of energy intensity and the increase of gas consumption for power generation can increase the consumption of natural gas. Fourthly, the direct factor affecting natural gas production is natural gas price. The increase of natural gas price has positive influence on natural gas production. The direct factors affecting natural gas price are urbanization rate, energy consumption structure and energy consumption intensity. The direct and main influencing factors of environmental governance intensity are natural gas price, urbanization rate, industrial structure, energy intensity and energy consumption structure. Finally, the forecast results show that under the high development scenario in 2025, the natural gas consumption of power generation, chemical and industrial fuel in China will be 66.034 billion cubic meters, 36.552 billion cubic meters and 109.414 billion cubic meters, respectively. Under the baseline scenario, the gas consumption of power generation, chemical and industrial fuels is 61.299 billion cubic meters, 35.528 billion cubic meters and 102.226 billion cubic meters respectively. Under the low development scenario, the natural gas consumption of power generation, chemical and industrial fuels is 57.767 billion cubic meters, 34.471 billion cubic meters and 96.918 billion cubic meters respectively.
According to the research conclusions of this paper, combined with the current actual development situation of China, we make the following proposals: First of all, at present, the main consumption industries of natural gas in China are power generation, chemical industry and industrial fuel. The natural gas consumption of the three sectors is closely linked and heterogeneous. The relevant government departments should make overall planning for the main consumption industries of natural gas, improve the market mechanism of natural gas, and realize the diversification of consumption structure of natural gas industry while comprehensively improving the demand for natural gas in China. In addition, the development of major natural gas consumption sectors cannot be separated from the construction of new urbanization and the transformation and upgrading of industrial structure. Therefore, China can accelerate the development of strategic emerging industries and modern service industries, promote regional coordinated development and new urbanization, and drive the growth of natural gas demand in various industries.
There are two limitations in this study. On the one hand, the relationship between variables is not static but dynamic, and our study did not capture the dynamic change relationship of variables. On the other hand, the prediction result of Bayesian network is an interval rather than a specific value, so other prediction models need to be combined to improve the prediction accuracy. Therefore, in future studies, we intend to use dynamic Bayesian network model to show dynamic causality between variables. More importantly, we will narrow the range of expectations as much as possible to make the results more accurate. On this basis, we will add indicators to analyze the influence mechanism of more variables in detail.
{{custom_sec.title}}
{{custom_sec.title}}
{{custom_sec.content}}
 PDF(983 KB)

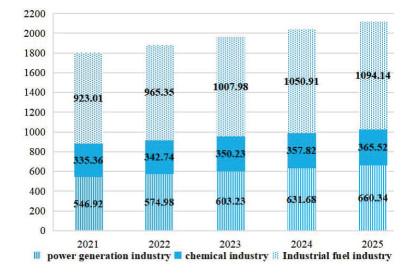
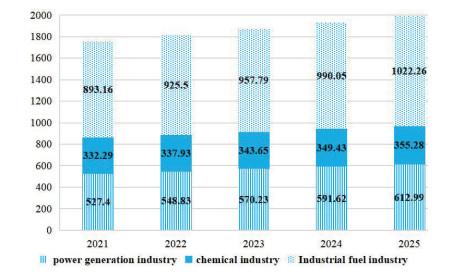
 Table 1 Influencing factors of natural gas consumption in three sectors
 Figure 1 Bayesian network model of natural gas consumption in three sectors


